Data Insights & Resources

Explore expert guides, tutorials, and best practices for data analytics, visualization, and business intelligence.

Latest

(8)
placeholder
Data Engineering
November 20, 2025
11 min read

Scaling dbt in Production: Advanced Materializations, the Semantic Layer, CI/CD, and Orchestration

dbt often enters an organization as a breath of fresh air. SQL becomes modular, lineage becomes visible, and the analytics team starts shipping faster than ever. But as more models, developers, and stakeholders enter the picture, the cracks begin to show. A single PR can break a dozen downstream models. A delayed job can hold up dashboards used by leadership. Incremental models that used to run in minutes suddenly balloon into hour-long builds. Scaling dbt isn’t just about performance. It's about reliability, maintainability, and protecting the people who depend on your data. Once dbt becomes mission-critical, it has to behave like production-grade software. This guide walks through what modern data teams actually do to scale dbt — the real-world patterns that work, and the pitfalls to avoid.

Pradeep Tamang
Read
placeholder
Agentic AI
November 7, 2025
5 min read

Learnings of Agentic AI Data Visualization

# Agentic AI Data Visualization - 10 Rules Everyone should Actually Use Agentic AI is useless if the visuals don’t drive a decision, trace back to the truth, and stay consistent across teams. We built DataToInsights.ai to make that the default, decision-first prompts, verifiable SQL and lineage, a governed semantic layer, and visuals that follow one visual language with fast insights. So, Here are some learnings from that Execution. ## 1) Start with the decision, not the chart Write the decision question first (“Should we shift 10% budget from A to B?”). DTI: You ask in plain English; the agent generates the answer with verifiable SQL and renders a visual aligned to that decision. ## 2) Match chart to relationship Trend → line, compare → bars, correlation → scatter, distribution → hist/box. DTI: The agent recommends the safest encoding for the task and explains why. ## 3) One takeaway per chart If a chart has two stories, make two charts. DTI: It pushes detail into small multiples or a drill, not clutter. ## 4) Color is a signal, not wallpaper Neutral context plus one accent. Keep meaning consistent across pages. DTI: Built-in color semantics (e.g., goal, variance, forecast) and accessibility checks. ## 5) Keep scales honest Bars start at zero; non-zero axes get called out; units and time are explicit. DTI: Scale guardrails and auto-annotations so you don’t accidentally lie. ## 6) Standardize the language of visuals Pick a house style and stick to it like labels, formats, variance markers. DTI: Ships with an enterprise style guide so every team reads charts the same way. ## 7) Put context beside the number Benchmarks, targets, YoY/plan variance right in the chart—no hunting. DTI: Auto-overlays baselines/targets and adds smart callouts on peaks, drops, anomalies. ## 8) Build a clear hierarchy Top row = outcome KPIs. Next = drivers. Bottom = diagnostics. Minimal, meaningful filters. DTI: Pages assemble as KPI → driver → detail, with 2–3 filters that actually matter. ## 9) Truth before polish Fix definitions, joins, and freshness first then style later. DTI: Governance-first pipeline with a semantic layer, tests, and lineage attached to every visual. ## 10) Close the loop and iterate Show it to someone outside the project; if they can’t explain the takeaway, refine. DTI: Review mode captures feedback; agents refactor layouts as goals and metrics evolve. ## Fast checklist of mistakes to avoid - Stacked bars when you need precise comparisons - Rainbow palettes and inconsistent color meaning - Non-zero bar baselines without a callout - Screenshot “reports” that go stale and lose trust - 20 filters no one uses; pick the two that drive decisions - No lineage, no approvals, no audit trail , aka “agent-washing” ## How DataToInsights.ai makes agentic viz production-ready? - Decision-first prompts to interactive visuals, You ask a business question then, we return verifiable SQL, the chart, and a plain-English rationale. - Governance baked into the workflows. - Semantic layer, data tests, and end-to-end lineage travel with every insight. - One visual language: Consistent themes, labels, and variance markers across teams and pages. - Accessible by default: Contrast/palette checks and color-blind-safe options out of the box. - Explainable & auditable: Every visual comes with sources, assumptions, and scale decisions, no black boxes.

Nimesh Kuinkel
Read
placeholder
Business Intelligence
November 3, 2025
10 min read

Why DataToInsights Wins in Self Serve Analytics?

**Summary** Self-service analytics should shorten the distance between a business question and a trustworthy answer. Most teams miss that mark because they bolt a chat UI on top of messy data and call it a day. This guide lays out what self-service actually is, the traps that kill adoption, and a concrete blueprint to make it work governed, explainable, and fast. I’ll also show how DataToInsights implements this blueprint end-to-end with agentic pipelines, a semantic layer, and verifiable SQL and lineage so non-technical users can move from raw files to reliable decisions without camping in a BI backlog. **
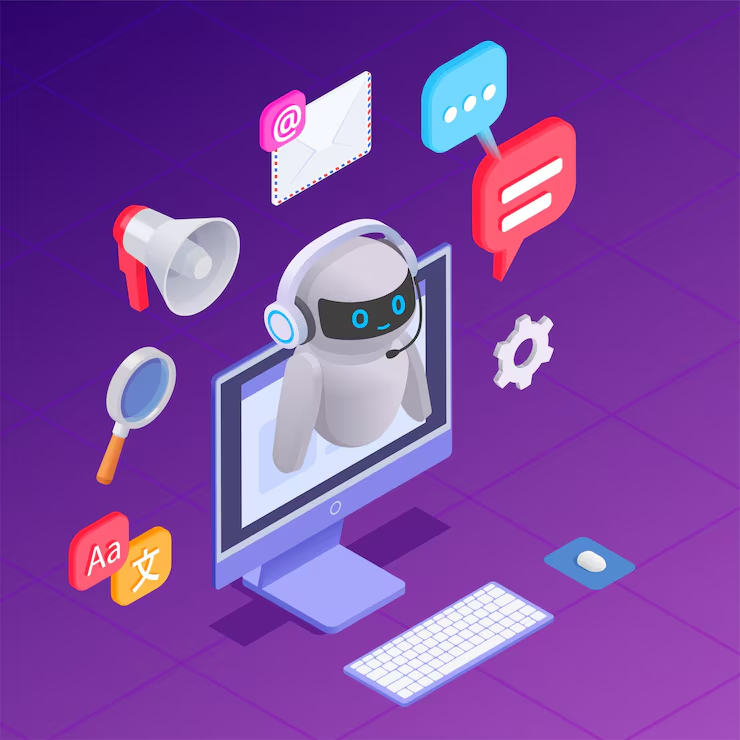
What is Self-Service Analytics mean?** The ability for non-technical operators (finance, ops, CX, revenue, supply chain) to ask a business question in plain language and receive a governed, explainable answer with evidence and without waiting on IT/BI team. The core promise: speed × trust. If you only have one without the other, it’s not self-service , it’s shadow IT or pretty dashboards. **Why Self-Service Often Fails?** - Messy inputs: files, exports, and siloed systems with inconsistent rules. - No semantic contract: metrics mean different things across teams. - Chat ≠ context: LLMs hallucinate when lineage and data quality are unknown. - Governance afterthought: access, PII, and audit left to “we’ll add later.” - BI backlogs: every new question becomes a ticket; momentum dies. **A. Practical Framework that Works** **1) Ingest & Normalize:** Bring in files, databases, SaaS sources. Standardize schemas, types, and keys. **2) Quality Gate (pass/fix/explain):** Automated checks for nulls, duplicates, drift, outliers, valid ranges, referential integrity. If something fails, suggest fixes or auto-repair with approvals. **3) Business Rules → Semantic Layer:** Codify definitions once: revenue, active customer, churn, margin logic, time buckets, SCD handling. Publish as governed metrics. **4) Context Graph:** Map entities (customer, order, SKU, ticket) and relationships. Attach glossary, policy, owners, and lineage. **
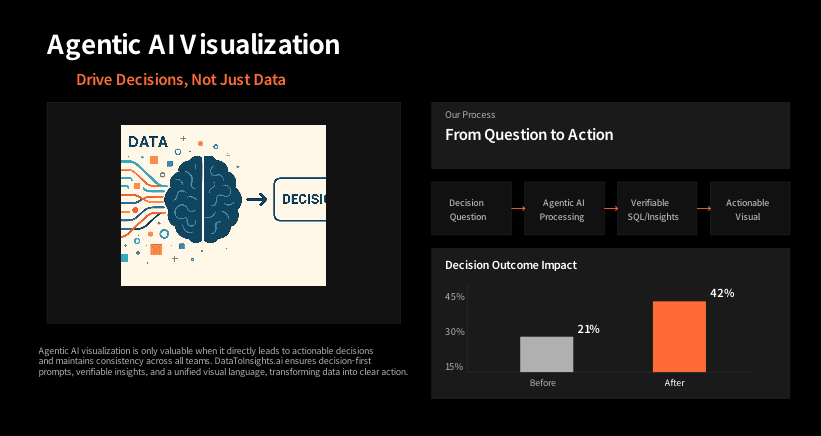
5) Agentic Answering with Evidence:** Natural-language Q → verifiable SQL on governed sources → answer + confidence + links to lineage, tests, and owners. **6) Distribution Inside Workflows:** Embed in the tools teams live in (Sheets, Slack, CRM, ticketing), schedule alerts, and push ready-to-act packets (not just charts). **7) Telemetry & Guardrails:** Track who asked what, which metrics were used, result freshness, and where answers created downstream action. **Pros, Cons, and How to Mitigate** _**Pros**_ - Faster cycle times from question → action - Fewer BI tickets; more strategic engineering - Shared language for metrics; fewer “dueling dashboards” - Better auditability and compliance _**Cons & Mitigations**_ - Misinterpretation → show SQL, lineage, and business definition next to every answer. - Data drift → continuous tests + drift monitors + alerts. - Policy risk → role-based access that flows from the semantic layer. - Tool over-reliance → embed owners, notes, and examples with each metric; keep humans in the loop for fixes. **Best Practices That Actually Move the Needle** 1. Question-first design: start with top 20 recurring questions by role. 2. Contracts before charts: metric definitions, owners, SLAs. 3. Declarative tests: nulls, uniqueness, ranges, reference lists, volume and schema drift. 4. Explainability by default: SQL, lineage, freshness, and pass/fail checks adjacent to the answer. 5. Right to repair: propose and apply data fixes, track approvals. 6. Embed where work happens: CRM, finance apps, helpdesk, Notion, Slack. 7. Measure impact: time-to-insight, avoided rework, decision latency, $$ outcomes. **What to Look For in a Self-Service Platform** 1. Agentic pipelines that prepare data (not just query it). 2. Semantic/metrics layer with versioning and RBAC. 3. Knowledge/lineage graph tied to every metric and answer. 4. Verifiable SQL behind every response—no black boxes. 5. Analytics-as-code (git, CI, environments, tests). 6. Data quality automation with repair suggestions and approvals. 7. Warehouse-native performance (Snowflake, Postgres, etc.). 8. Embeddability (SDK/API) and alerting. 9. Audit & compliance built in (PII policies, usage logs). **Why DataToInsights is the Best Choice?** Built for operators, not demos. DataToInsights is a Vertical-Agnostic Agentic Data OS that takes you from raw inputs to governed answers with receipts. **What you get day one?** - Ingestion & Normalization: files (CSV/XLS/XLSB), DBs, and SaaS connectors. - Auto DQ Gate: 20+ universal checks (nulls, dupes, ranges, drift, schema) with auto-repair options and approval workflow. - Semantic Layer: consistent metrics, time logic, and currency handling, versioned and role-aware. - Context & Lineage Graph: entities, relationships, ownership, and end-to-end lineage rendered for every answer. - Agentic Copilot: NL questions → verifiable SQL + explanation + confidence; no vibes. - Analytics-as-Code: git-native changes, CI checks, dbt-friendly, environments, and rollbacks. - Embeds & Alerts: push insights into Slack, email, Sheets; embed widgets in internal tools. - Warehouse-native: runs close to your data (Snowflake/Postgres), no lock-in. **How it’s different?** - Answers with evidence: every response shows SQL, tables touched, tests passed, and metric definitions. - Fix the data, not just the chart: when checks fail, our agent proposes specific transforms (dedupe, type cast, standardize codes) and can apply them with audit. - Playbooks that ship: finance, CPG, operations, CX—starter question sets, metrics, and policies you can adopt and edit. - Governance woven in: RBAC, PII policies, metric ownership, and audit logs are first-class—not an afterthought add-on. **Outcomes teams report?** - 70–90% fewer BI tickets for recurring questions - Minutes (not weeks) to get a governed answer - Measurable reduction in decision latency and rework - Higher trust: one definition of revenue/churn/COGS across the org

Nimesh Kuinkel
Read
placeholder
Data Engineering
November 1, 2025
10 min read

Great Expectations: The Complete Guide to Ensuring Data Quality in Modern Data Pipelines

In a world where decisions are increasingly **data-driven**, one bad dataset can derail an entire analytics effort or machine learning model. We often focus on **building pipelines** but neglect to ensure that what flows through them --our data-- is actually **trustworthy**. That’s where **Great Expectations (GX)** steps in. > Great Expectations is an open-source framework for validating, documenting, and profiling data to ensure consistency and quality across your data systems. This guide will walk you through **everything you need to know** about Great Expectations -- from fundamental concepts to hands-on examples, all the way to production-grade integrations.

Ajay Sharma
Read
placeholder
Agentic AI
October 28, 2025
5 min read

Building an Enterprise-Grade Agentic Analytics Platform

In the age of AI-driven analytics, many organisations are seduced by the idea of “just plug an LLM to your warehouse and ask anything”. Most teams do not pay attention to the massive engineering effort required to make the conversational analytics work in production, at scale and with real enterprise data. To succeed in production, you need more than a chat interface — you need an architecture built to understand semantics, learn from usage, secure retrieval, and enforce governance. In this post we’ll walk you through a blueprint for such a platform, anchored around three key layers: - A Custom Data Understanding Layer that interprets structure, semantics, and business use-cases - A Learning & Retrieval Layer that evolves and retrieves context-aware information - A Secured Retrieval & Execution Stage that ensures safe, performant, governed answers - We’ll also highlight why these capabilities matter, what pitfalls to avoid, and how to build each layer effectively.

Sashank Dulal
Read
placeholder
AI
October 28, 2025
5 min read

Secure & Governed Agentic Analytics with datatoinsights.ai: How to Build Trust at Scale

The shift from dashboards and manual queries to autonomous analytics agents is well underway. But as organisations rush to adopt “agentic analytics” — systems that reason, query, act — they often stumble on a critical dimension: trust, governance and security. Industry research confirms this: for example, the consultancy McKinsey & Company observes that agentic systems “introduce novel internal risks … unless the principles of safety and security are woven in from the outset.” [(McKinsey & Company) ](https://www.mckinsey.com/capabilities/risk-and-resilience/our-insights/deploying-agentic-ai-with-safety-and-security-a-playbook-for-technology-leaders?utm_source=chatgpt.com) At datatoinsights.ai, we’ve built our platform not just for semantic intelligence and business agility (as covered in our previous blogs) but with governance, security and operational guardrails baked-in. This blog explains how we deliver that, and why it matters.

Sashank Dulal
Read
placeholder
AI
October 27, 2025
5 min read

Why Agentic AI Analytics Struggle on Real Production Data & How to Fix It

The promise of **agentic analytics** — AI systems that understand natural language, query data, generate insights, and even take actions — is incredibly powerful. However, as many data leaders will attest, the excitement often fades once these systems meet **real production data**, **real business logic**, and **real users**. As Tellius notes in *“10 Battle Scars from Building Agentic AI Analytics,”* the biggest challenges appear not in demos, but in production environments. One of the most common root causes of failure is **missing semantic awareness** — raw, messy data, vague business definitions, and unclear logic that derail even the smartest models. In this post, we’ll: - Explore **why agentic analytics struggle** in real-world environments - Highlight **key failure modes** seen across the industry - Offer a **practical checklist** for practitioners - Answer SEO-friendly questions like: - *What is agentic analytics?* - *Why is a semantic layer critical?* - *How can organisations succeed in production?*

Sashank Dulal
Read
placeholder
AI
October 27, 2025
5 min read

Traditional BI Is Fading — How datatoinsights.ai Powers Smart, Semantic Analytics on the Go

For years, business intelligence (BI) tools delivered dashboards and reports that helped organisations monitor what happened. But as business environments evolve with faster data, more complexity, and higher expectations — traditional BI is showing its age. Studies now argue that legacy BI isn’t just struggling — in many respects it’s already outdated. [(RTInsights)](https://www.rtinsights.com/traditional-business-intelligence-isnt-dying-its-dead/) In contrast, platforms like datatoinsights.ai are built from the ground up for the demands of today: semantics, conversation, mobility, real-time, and business context. In this post we’ll: - Explore the core limitations of traditional BI - Explain the new demands on analytics in the enterprise - Show how datatoinsights.ai meets those demands - Outline practical steps to transition successfully

Sashank Dulal
Read
Page 1 of 1

Ready to Achieve Similar Results?

Let's discuss how Data2Insights can transform your data operations.